

Data-driven decision-making – how to get started with bi?
Getting started with Data-Driven Decision-Making (DDDM) may seem like an insurmountable challenge to many companies. When you start to research the field, you will quickly reach keywords such as big data, modelling, and artificial intelligence. Often, you will also find that the need to create a data lake is also mentioned.
Although dependent on the company, many consider the effort and investment needed to work with DDDM too much and write it off as unnecessary. The more you read about DDDM and data analytics, the more complicated it all seems. And the biggest question you may be asking yourself this whole time is whether a small or medium enterprise should even bother with data analytics.
What are we talking about and which words do we use for that?
Before you read on, we should first define a couple of terms since they overlap in some parts and may cause confusion. Data-Driven Decision-Making means making decisions based on actual data that has been analysed. In essence, it is the opposite of intuitive or observatory decision-making. The spread of DDDM is supported by various technological tools and the development of data analytics.
Data analytics is a branch of science that focuses on coming to conclusions about data by analysing it. Data analytics’ activities and methods are automated with algorithms to make the raw data more understandable for humans. Data analytics allows us to reveal trends that would otherwise go unnoticed and to use the information gained from that to make data-driven business decisions.
The simplest definition is as follows – Data analytics is the practical implementation of data science methods for automatically processing big data. This results in diagrams, trend prognoses, and recommendations that people without a background in programming or statistics can use to make data-driven decisions.
Another term that is used often is business intelligence (BI) – an aggregate of methodologies, processes, architecture, and technologies, which helps us to turn data into contextualised information that supports effective tactical and strategical decision-making.
Reality check
If you participate in various seminars and conferences, you will often hear inspiring stories about how artificial intelligence will come along and solve all the challenges found in data analytics and DDDM.
Additionally, it is often emphasised how machine learning can help us uncover hidden connections in data that people would be unable to notice, which is why we should leave all decision-making to machines instead.
Technically, it is true that machine learning makes it much easer to recognise patterns, but it is not the only way of getting value out of data.
A recent study conducted by MMC Ventures shows that out of the 2830 AI start-ups registered in Europe, 40% do not use any kind of AI themselves. Artificial intelligence helps to create value and its cost of use is going down all the time.
You should think critically about the use of artificial intelligence and consider how small and medium enterprises could also reap the benefits from the use of data today.
If we look at company assets, then employees are usually considered to be the most valuable since they consolidate the personal contacts, skills, and knowledge needed for the organisation to work.
The second most important thing is data, which provides us an overview of the current state of the organisation and its history – transactions, bills, clients, partners, stock etc. If something should happen to the software that uses this data, then it can be restored.
The high value of data comes from its hidden potential for optimising processes, revealing underused sales opportunities, finding production bottlenecks, or identifying the most optimal location for the next physical store.
Logically speaking, data can be alive or dead. Living data is used to make everyday decisions and it is always relevant. Dead data has been collected somewhere, but it is no longer relevant or it is not used for solving business problems or making decisions.
There are four main reasons for why data is not used:
- It has become outdated due to changes in the business environment and there is nothing more to be learned from it.
- It is unknown what kind of data exists, where it is located and what its quality is.
- The responsible parties are unable to form questions that could be answered by data analysis.
- There is no technical platform or the skills needed for getting the value from the data.
- Data that is dead because of reasons 2-4 can still be used and made to work for the company’s benefit.
The different maturity levels of dddm
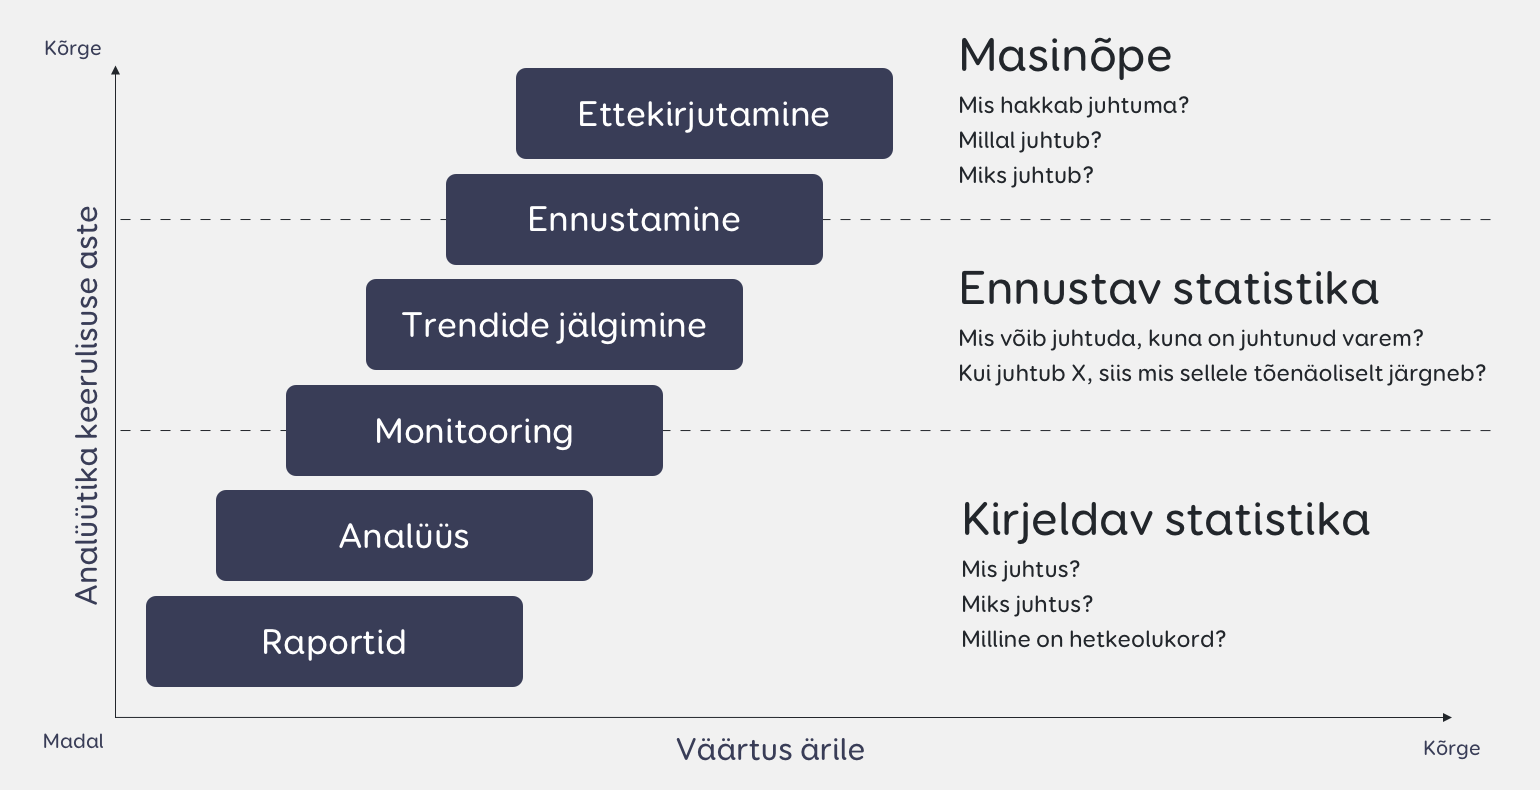
It is worthwhile to look at DDDM through a maturity level that focuses on complexity and business value. It should also be mentioned that various maturity models exist and that some of them focus on an organisation’s capabilities (employees’ skills, use of technologies, data management etc.). I
n this case, we will be looking at the Arbela Maturity Model, which consists of three main maturity levels and six sublevels. Here, we will be taking a closer look at the three main levels.
Descriptive analytics – The lower maturity levels focus on reports, retrospective analysis and monitoring the current situation via KPIs. Above all, this level answers the questions of what happened, why it happened and what is the situation today. The main focus here is on the retrospective analysis of existing data, which enables us to learn from the past and to get an overview of the current situation.
Descriptive analytics is divided into further sublevels that are characterised by how the data is near real-time and how it is actively monitored. Examples of this are various dashboards and reports.
Predictive analytics – The first important change will happen when you use models to fill in the gaps in your data and to make future predictions. At the same time, it is important to keep in mind that no model can ever predict the future precisely and that external shocks can affect the predictions.
Predictive analytics looks for connections between past data, identifies trends, and applies them to future predictions. Examples of this are identifying customer purchase patterns and planning production based on demand.
Prescriptive analytics – The focus here is on modelling various scenarios based on user choices. In other words, what happens when a user makes a decision. An important supplemental factor is that the model can also be used to generate recommendations for decision-making.
For example, if there are many products in a product portfolio and not all of them create profit, then the model will provide recommendations for which products to remove along with an assessment of how that would affect the company’s business results.
The emphasis is on identifying the causal connections between decisions and outcomes.
*Business value and methodology axes
Getting started with data-driven decision-making
A 2018 study conducted by Garner shows that the maturity of 87.5% of companies is low and, at best, those companies limit themselves to the maturity level of descriptive analytics. This means that data is analysed based on ad hoc needs.
Oftentimes, only Excel is used, and special solutions are only used for specific cases, but the maturity level is dependent on the excitement-based activities of a few individuals. If a company wishes to get started with DDDM but is unwilling to spend a lot on it, then there are still a couple of tactical moves that can be made.
- Set down your goals for DDDM
Set down the goals for what you wish to achieve with DDDM. If the goal includes different maturity levels, then it is useful to split it into achievable steps. There is no need to try to jump over your own shadow.
The goals should include business-related questions that the company wishes to answer in a data-driven manner by using data analytics. Basically, there are questions that, when answered, help the company to increase their revenue. For example:
- Which products should be packaged together?
- Who are my biggest clients, and have we fully realised our sales potential with them?
- Where are the bottlenecks in my production process that delays 15% of all products?
When implementing DDDM, you must have a clear goal with an outcome that can be clearly seen in the company’s financial results.
Once, I conducted a workshop in a company that deals in commerce. The goal of the workshop was to generate questions that could be answered with data analytics. Many of the ideas were of the kind that could be answered with data analytics but could not be used to make any decisions regarding changes in the company’s activities.
For example, one of the questions was how the weather affects in-store revenues. Based on the data available, we can identify the connection, but the company could not have actually done anything with it, because a) you cannot control the weather and b) they will not be partially closing their stores because of weather.
In contrast, analysing the differences between customer purchase habits in the Baltics is the type of information that can be used to change which products and how many of them should be ordered for a particular country. This creates actual business value.
- Create a structure in your company to support DDDM
Working on DDDM and data analytics cannot be one of the company’s many secondary work tasks. This does not mean that you should hire a separate person for this. However, it is important to assign the responsibility to someone along with a set amount of work time dedicated to this.
Data analysis requires concentration and it cannot be done casually during a 10-minute break as the quality of the results will be severely affected by this. The need for specialisation appears as the DDDM in the company matures.
- Identify your data sources
Often, a company’s data is spread out among different information systems and it is usually held in Excel files, is disorganised, and the quality of the data varies. Organising the data brings more complexity into the company, but not so much that it becomes impossible to also get the benefits that data can provide.
Just recently, I advised an institution whose core business process involved customer service and they wanted to know how well they were making use of their resources. The employees who provide the service were in one information system, but other resources used to provide the service (e.g. rooms) were in another. Unfortunately, the different types of data were not saved in comparable formats.
To make matters worse, the software they were using for resource management even had a data aggregation and analysis functionality built into it, but it did not display the data correctly. After working a bit with the base data, we were able to derive realistic utilisation estimates from it.
In some cases where the company thought they had used about 80% of their resources, it turned out that they were actually utilising less than 30%. The data analysis helped them identify important opportunities for optimising their service.
- Pick a platform for the analytics
While Excel is all-powerful, it does require more advanced knowledge for more complex analyses. Multiple tools have been created to simplify the analyses required for DDDM. Of course, the implementation of these also means that there is a learning curve involved in the beginning, but it may still be significantly easier than learning Excel’s more advanced functions.
Additionally, these tools support better data visualisation. Gartner has listed the following solutions as leading ones in their field:
- Microsoft Power BI
- QlikSense
- Tableau
- QlikView
- ThoughtSpot
For example, QlikSense has been significantly simplified to accommodate less experienced users. It allows users to make simplified and well-visualised connections between different databases. In turn, this means that users can get the answers they need to make data-driven decisions from the raw data much faster.
In conclusion
The world of Data-Driven Decision-Making seems complicated and you can drill down deep into it to a very detailed level. But if you ask the right questions, you can get a lot of value out of your data, which far surpasses the effort you need to make for it.


