

How to Navigate the World of Data Analytics: Concepts, Data Migration, and Cross-Usage
In today's technology-rich business world, data analytics is of critical importance as it enables organisations to make informed decisions, thereby improving company efficiency and competitiveness.
In this article, we'll introduce you to important concepts and processes related to data migration to help you better navigate the exciting world of data analytics.
Key Concepts Explained
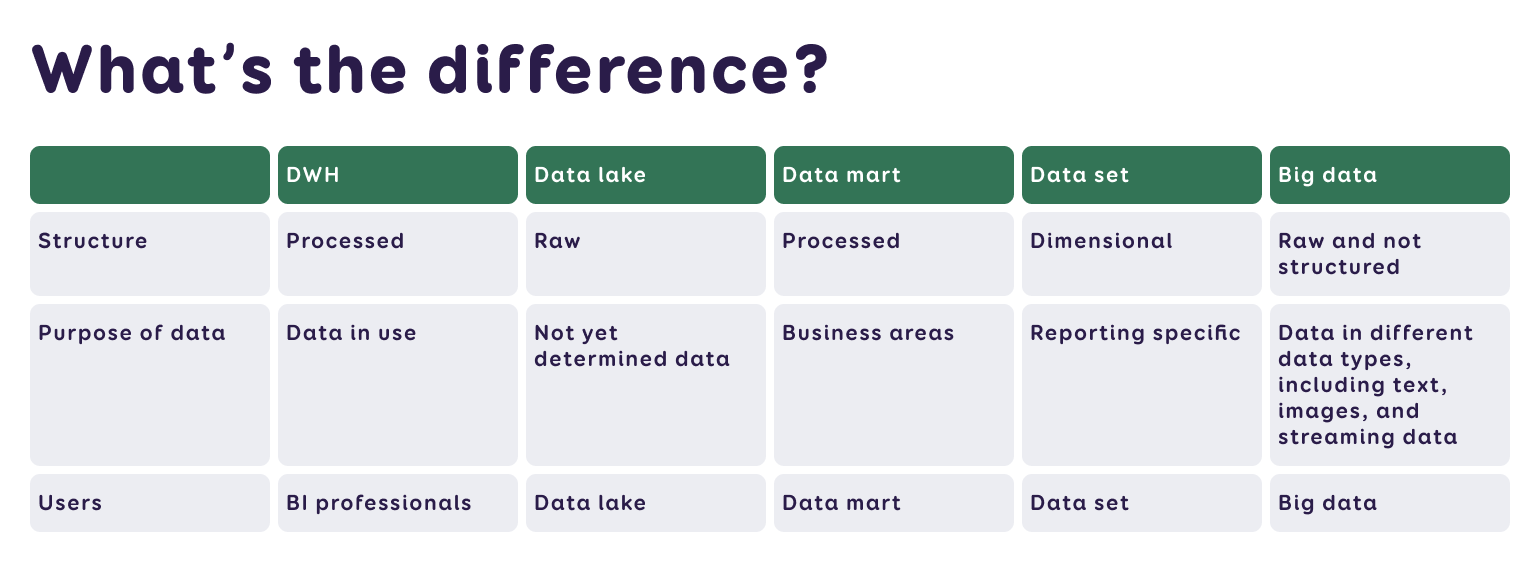
Data Warehouse (DWH) – A collection of structured data gathered for a specific purpose, i.e., a database or databases. It is considered the central repository of an organisation's data.
Data Lake – A collection of unprocessed (raw) data, often used as a primary source in machine learning. It may also contain an entire organisation's dataset, but unlike a data warehouse, it may not yet be deployed for a specific purpose.
Big Data – Encompasses a variety of formats and unstructured data, such as web statistics, social media, sensors, text documents, audio, video, etc. While data warehouses are more about architecture, big data is more about technology.
Data Mart – A smaller version of a data warehouse, created for a specific business area, allowing for more specific analysis.
Dataset (Semantic Model) – A layer of data with business concepts, situated between the data warehouse and reports, created for specific reporting needs (e.g., profit reports).
Data Flow – The process of loading data where data is transported from one location to another. This process is essential for data integration and preservation.
Masterdata – A central data collection used when primary information is not available from the information system. For example, if cost information for a product is not available in an application, a specialist can manually enter this information on a prepared form (Excel, App, etc.) and integrate it into the data warehouse.
In addition to managing individual data, the term masterdata is also used when it is necessary to link the same dataset from multiple original sources, such as customer registers from different countries' branches of a company.
ELT (Extract, Load, Transform) Methodology – The process begins with collecting data from the original source and the necessary data is lifted in an unprocessed form into the data warehouse. During the data transformation phase, data is enhanced or errors are corrected to ensure data accuracy and reliability.
After ELT, the data is linked into an optimized semantic model and presented to users in an understandable and suitable form. This newer methodology differs from the previously used ETL term in that transformations are done after loading.
The Journey of Data Analytics: From a Large Amount of Data to a Report
The Kimball methodology model illustrates the connections between the front-end and back-end, offering a visual overview of the process where raw data becomes reports and decision support. The process is divided into three stages: data preparation (ELT), the business model layer, and presenting results with analytical capabilities.
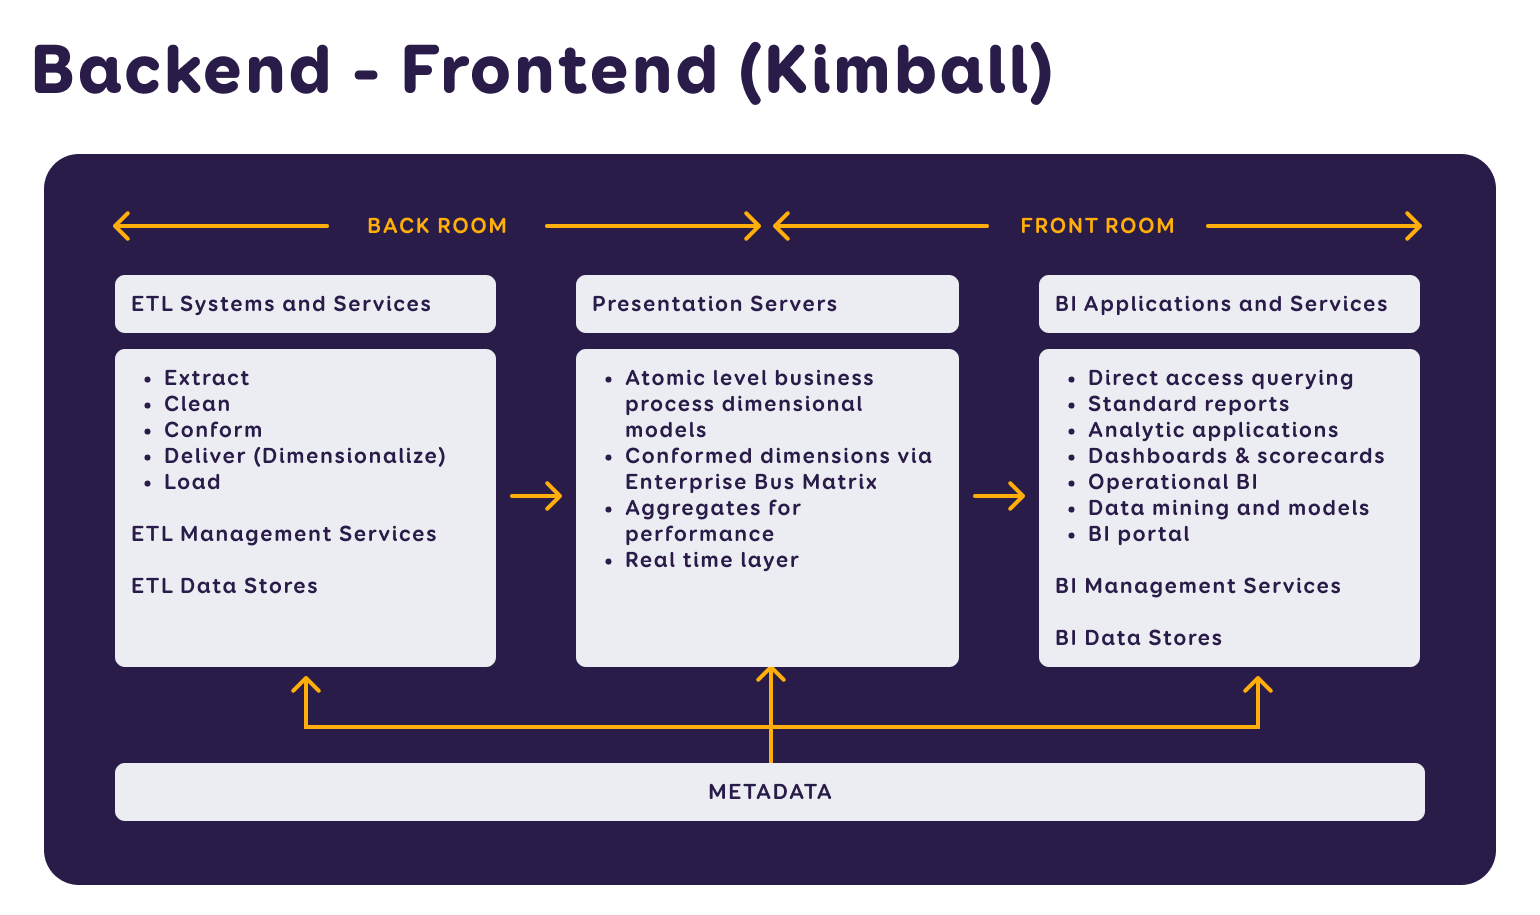
To provide effective BI (Business Intelligence) solutions, our affiliate Intelex Insight has developed standards for designing data architecture.
These encompass principles, rules, and models for collecting data, describe the management and preservation of collected data, ensure data confidentiality and security, provide an overview of reporting, and prepare for user-side data analysis. Next, we'll explore what happens behind the scenes in data preparation.
ELT (Extract, Load, Transform) - Collecting, Loading, and Modifying Data
The ELT process involves collecting data from original sources, loading it into a data warehouse, and then modifying it. There are different ways to do this, depending on the specific data policies and the technological solutions chosen.
Regarding technology, data processing can be done using Microsoft Visual Studio tool which is quite self-documenting due to its visual components. Alternatively, when solely programming loading scripts, these must be well documented.
For identical original sources, we recommend using an iterative solution (a loop). For larger amounts of data, web services output data in batches (e.g., 20,000 records at a time), It is also advisable to distinct modified data in source.
Why is a Data Warehouse (DWH) Needed?
The data warehouse (DWH) is a critical component that helps you efficiently manage and analyze your data. A data warehouse allows you to…
- Track data changes over time. For example, it enables you to view inventory changes over days, months, or quarters, creating a data history not found in the original source.
- Manage master data even when this information is missing in the original sources. For example, you can use Excel or a Power Apps-like app for entering additional data, which is then stored in the data warehouse.
- Preserve historical data, especially in situations where information gradually disappears from original sources.
- Optimize data querying: unlike application databases optimized for data entry, data warehouses are optimized for querying data. Data can be structured or aggregated to make querying as efficient as possible.
- Integrate and cross-use various original sources, creating a unified database. This can mean linking different systems of one company (sales, inventory, finance, production, working hours, etc.) or integrating data from different companies in a group for a consolidated sales view, or using public data in company metrics.
- Create analytical business overviews tailored to the organization's needs and habits.
- Provide more detailed reporting: compared to original sources, data warehouses offer the opportunity to create more detailed reports that are important for decision-making.
Why Use Relational vs. Non-Relational Databases?
Primarily, information systems are linked with relational databases, and the original sources for analytics solutions are mostly relational databases like MS SQL Server, Oracle Database, PostgreSQL, MySQL, MariaDB, etc.
Relational databases are structured in tables, allowing data to be effectively organized and managed, thus forming a strong basis for complex queries and data analysis.
Sometimes, however, there is a need to preserve certain types of data that are more optimally stored in non-relational databases. For example, Intelex Insight uses log files and document or image files for machine learning and artificial intelligence (AI) solutions.
Unlike relational databases, which store data in strictly defined tables, non-relational databases allow data to be stored more flexibly. Storing data there is often more cost-effective, especially for large data sets.
Database Normalization vs. Denormalization?
Normalization aims to reduce data redundancy, ensuring system efficiency in data entry and update processes. By decreasing the occurrence of redundant values in tables, the quality of database management improves. In information systems, a database is usually considered normalized when it meets the requirements of the third normal form (3NF).
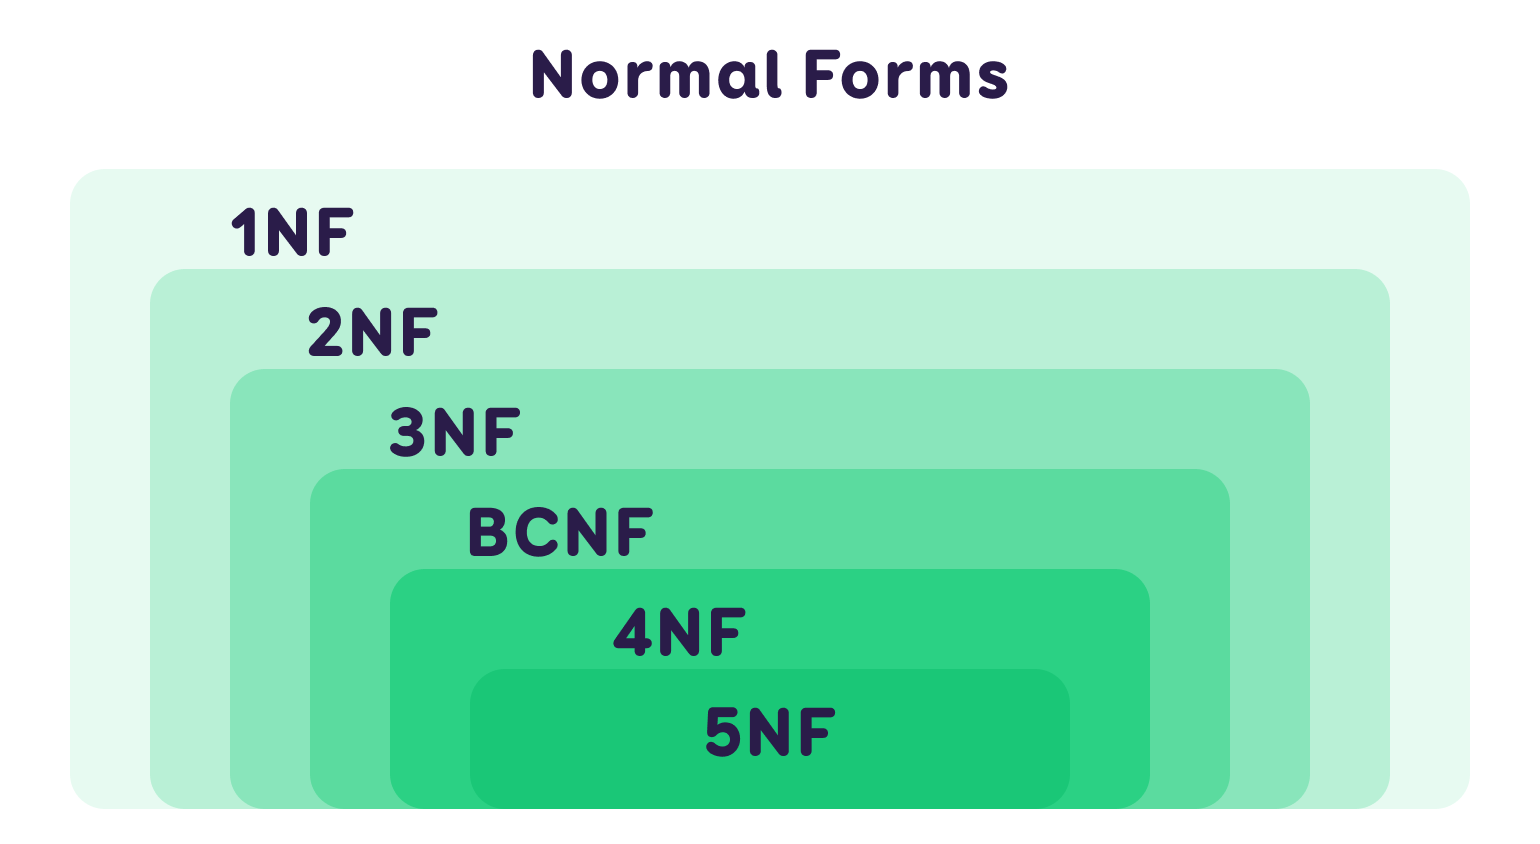
Denormalization, on the other hand, focuses on reducing the relationships between tables to optimize data reading. Excessive relationships can slow down database query processing, so denormalization helps improve query performance, making the database more responsive to queries.
Dimensional Structure
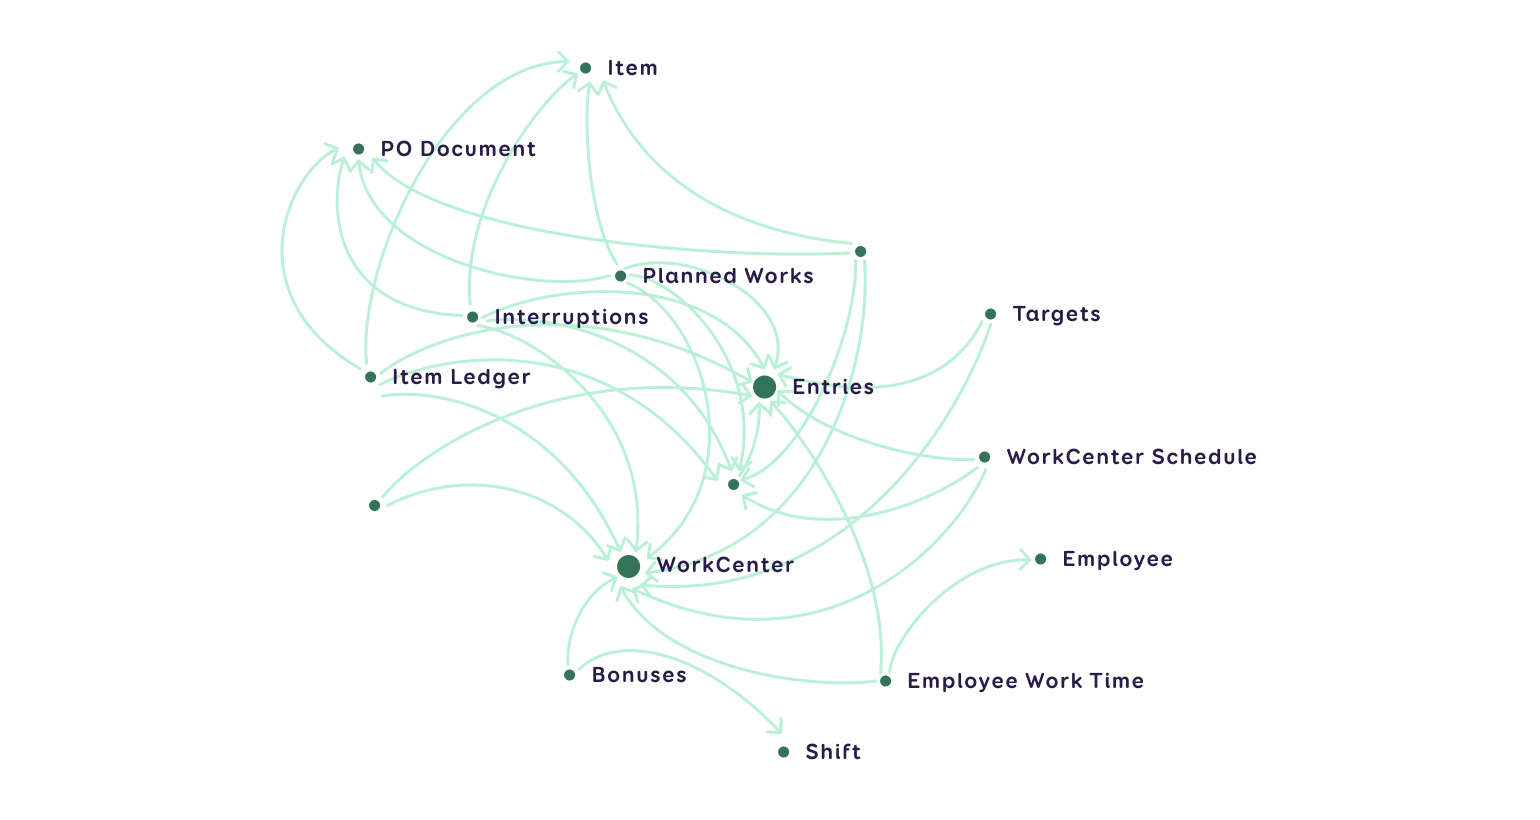
Structuring data according to business processes and common dimensions (across which reporting is viewed) provides an intuitive view of the data and allows business users to navigate data more easily.
This structure is also known as the Bus Matrix or Star Schema. In this structure, data is distributed in a way that highlights their relationships and patterns. This method has proven effective in presenting reports.
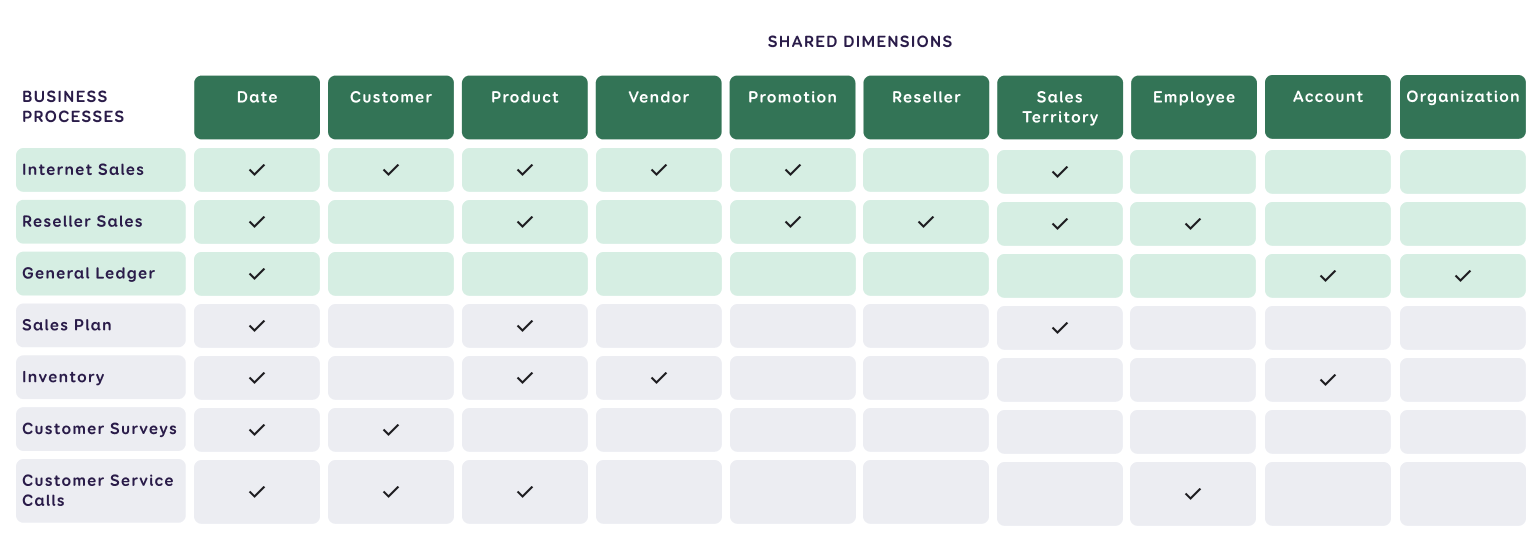
The following figure illustrates the same scheme of one model in another form:
A Structured Data Warehouse Ensures Data Manageability and Security
A structured approach to data management in a data warehouse not only ensures better data manageability but also their security. It is advisable to divide the data into layers, which allows for the separation of different types of data and managing access to them as needed.
In theory, the following layers are distinguished:
- Staging (STG) – This layer is mostly intended for temporary data storage.
- Operational (OD) – Here reside the raw or unprocessed data, which are loaded directly from data sources and await further processing.
- Processed (PD) – In this layer, data are brought closer to a dimensional structure and are reprocessed to support analytics and queries. Often, this layer is built as views if physical tables are not necessary.
- Report (RD) – The reporting layer contains reports and specific tables or views related to solving certain business problems. Many organizations place their data models in this layer.
- Data Access Layer (DAL) – This is an external layer of the data warehouse where reports and analyses are kept.
- Occasionally, STG+OD or PD+RD are combined, depending on the organization's needs and the complexity of the data architecture.
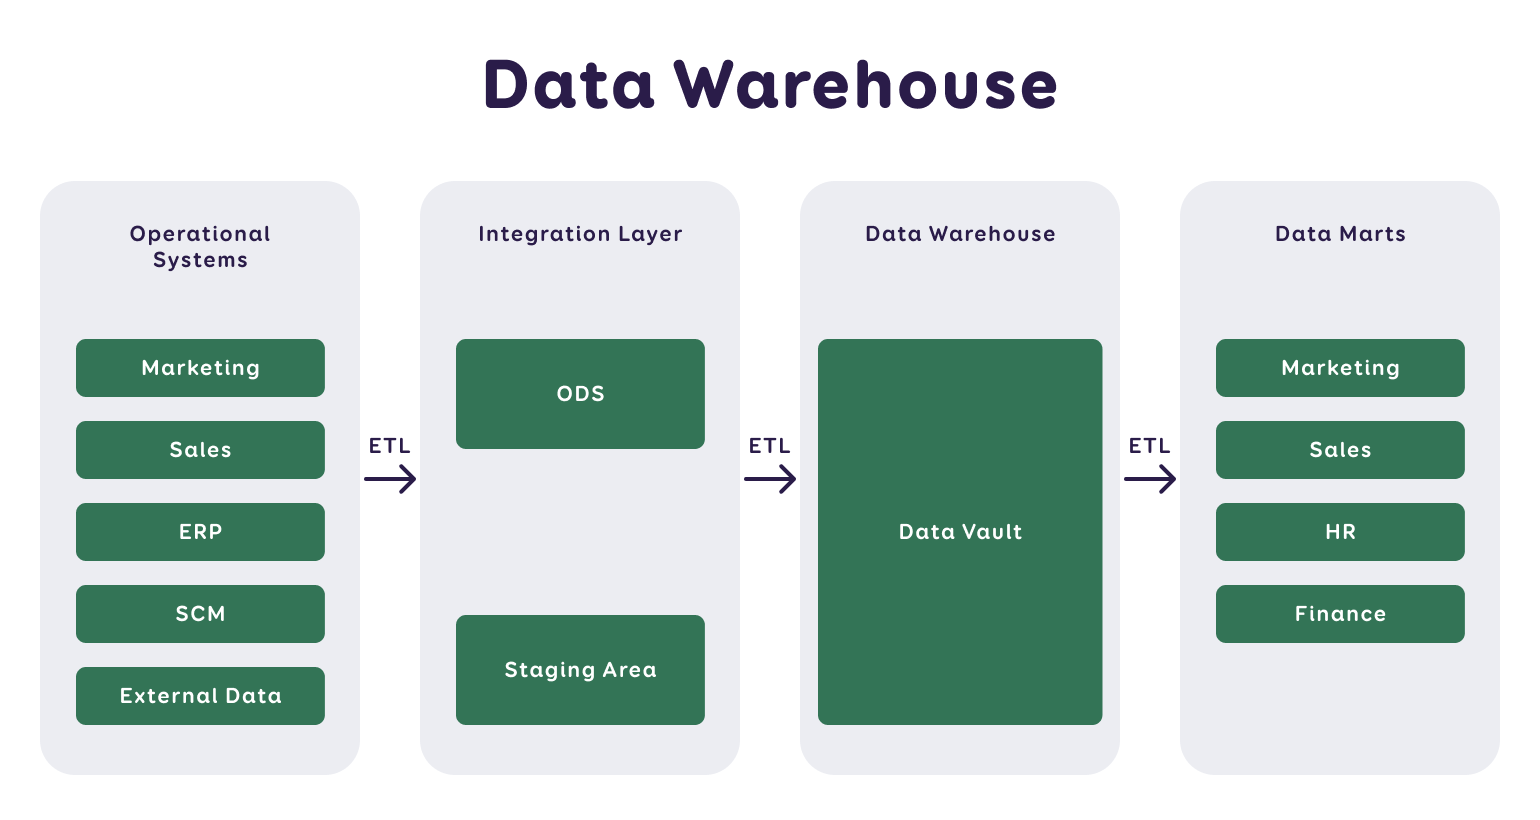
The following figure is another illustration of how raw data is transformed into specific data marts or semantic models. Starting from the original sources, data are first loaded into the raw data layer (STG, OD), after which they are processed in the data warehouse (PD, RD). Subsequently, specific domain data collections (data marts) and semantic models (datasets) are created, intended for end-users.
The Importance of Metadata
Metadata is documented information that provides an overview of the data warehouse architecture, the data, and the associated logic and processes. Every organisation should have a complete description of its data resources, including a list of tables, data sources, their applications, and more.
Three types of metadata are distinguished:
- Technical Metadata – These explain the technical details of the data warehouse or BI system, including processing processes.
- Business Metadata – These describe the content of the data warehouse in business terminology, including the availability of data, their origin, meaning, and relation to other data.
- Process Metadata – These describe the outcomes of activities in the data warehouse, such as data updating procedures, schedule, and frequency. During the loading process, it is advisable to save logs that document the success of overnight loads and, for instance, the number of data records.
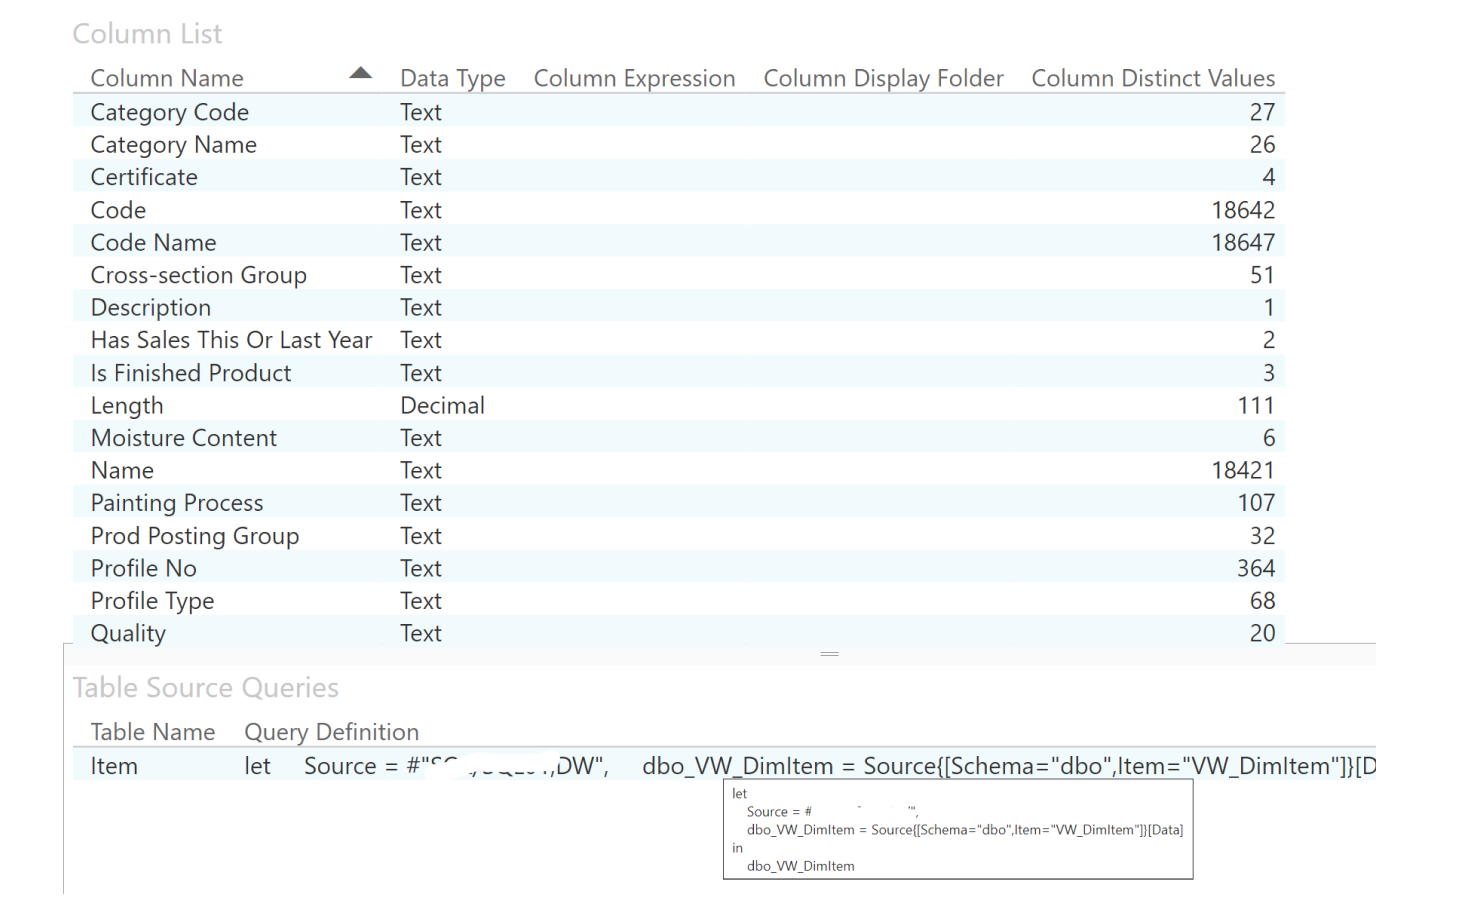
Example of Business Metadata: In the leftmost column, the attributes or data fields available in the product dimension are listed, and it is possible to see the format of each attribute and the number of unique values.
When pointed at with an arrow, the business metadata section that appears provides information about the source of this dataset - for example, in this case, the data originates from a specific SQL data warehouse view.
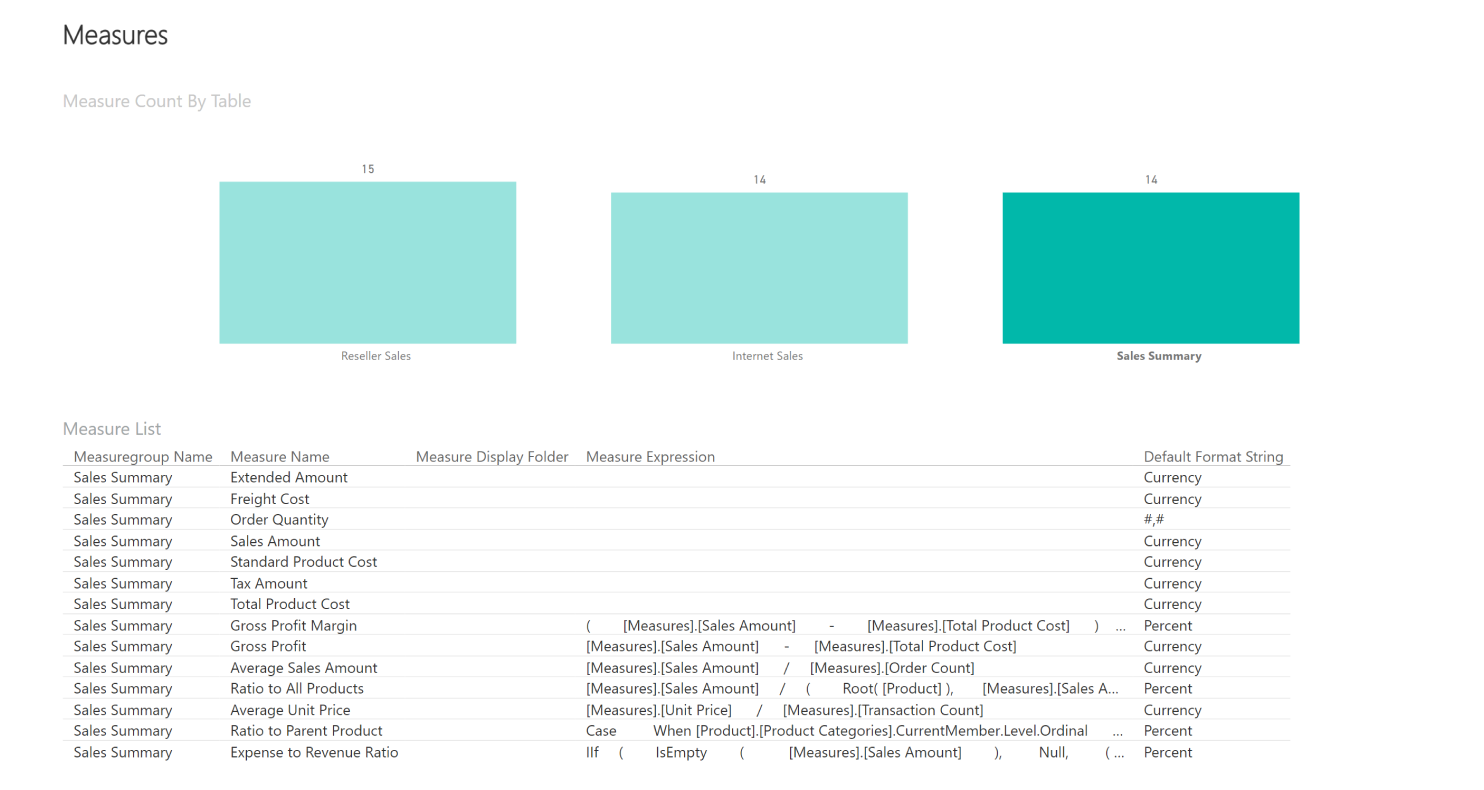
In addition to this, it is important for users to know which metrics are represented in the tables and what formulas have been used in the analysis of the data. To ensure transparency and understanding, Intelex Insight provides its clients with access to such metadata information alongside the reports.
Principles of Developing a Data Warehouse (DWH)
In developing a data warehouse, several important aspects must be considered. Below, we outline seven key principles that Intelex Insight follows in its projects and recommends for every organisation's data warehouse development:
- Uniform Terminology – At the beginning of the project, we agree with the client and within the team to define the terms and concepts used in the project. This ensures a common understanding for all parties, and documented terminology helps maintain consistency, even if the team composition changes.
- Language Choice – We agree with the client on the language in which the data warehouse and its outputs (such as reports) and work outcomes will be presented.
- Use of Schemes – For visualization, we use schemes and diagrams that help better understand data structures and their interrelations.
- Data Loading – It is important to monitor the loading time and document references to original sources when loading data. An OriginID solution can be helpful here, simplifying the tracking of data origin.
- Confidential Data – To ensure security and handle sensitive data, we agree with the client on how the data warehouse will be further developed and who will have access to which data.
- Data Updating – It is necessary to consider that moving data takes time. For example, in the case of accounting entries (where an accountant can only change the last fiscal year's data) and sales data (where only the last month's data can change), there is no need to update earlier data. If a record has change information available, updates can be made accordingly.
- Data Accuracy Checks – This is important at every stage of data loading and the BI project. Checking the data ensures data quality and reliability.
Modeling in Data Processing
Modeling appears to be a somewhat underrated aspect of data analytics. One of the objectives of a semantic model is to provide the business user with an understandable view of the data so that if a pre-made report is insufficient, the user can modify and supplement the report or even create a new one (this is not complicated).
The advantage of data models is that, generally, they are well optimized for queries by their engine. Depending on the tools used, different methods are employed - for example, MS Power BI uses the VertiPaq Engine in its tabular model, which efficiently compresses data.
However, in creating a model, one must also follow the best practices of development, and it is important to focus only on the data necessary for the end user. Excessive information can create so much noise in the model over time that it ultimately becomes unusable.
MS BI solutions tools
Intelex Insight uses Microsoft's suite of tools for the implementation of data-based reports and data mining projects. We provide a brief overview of the main tools and their applications:
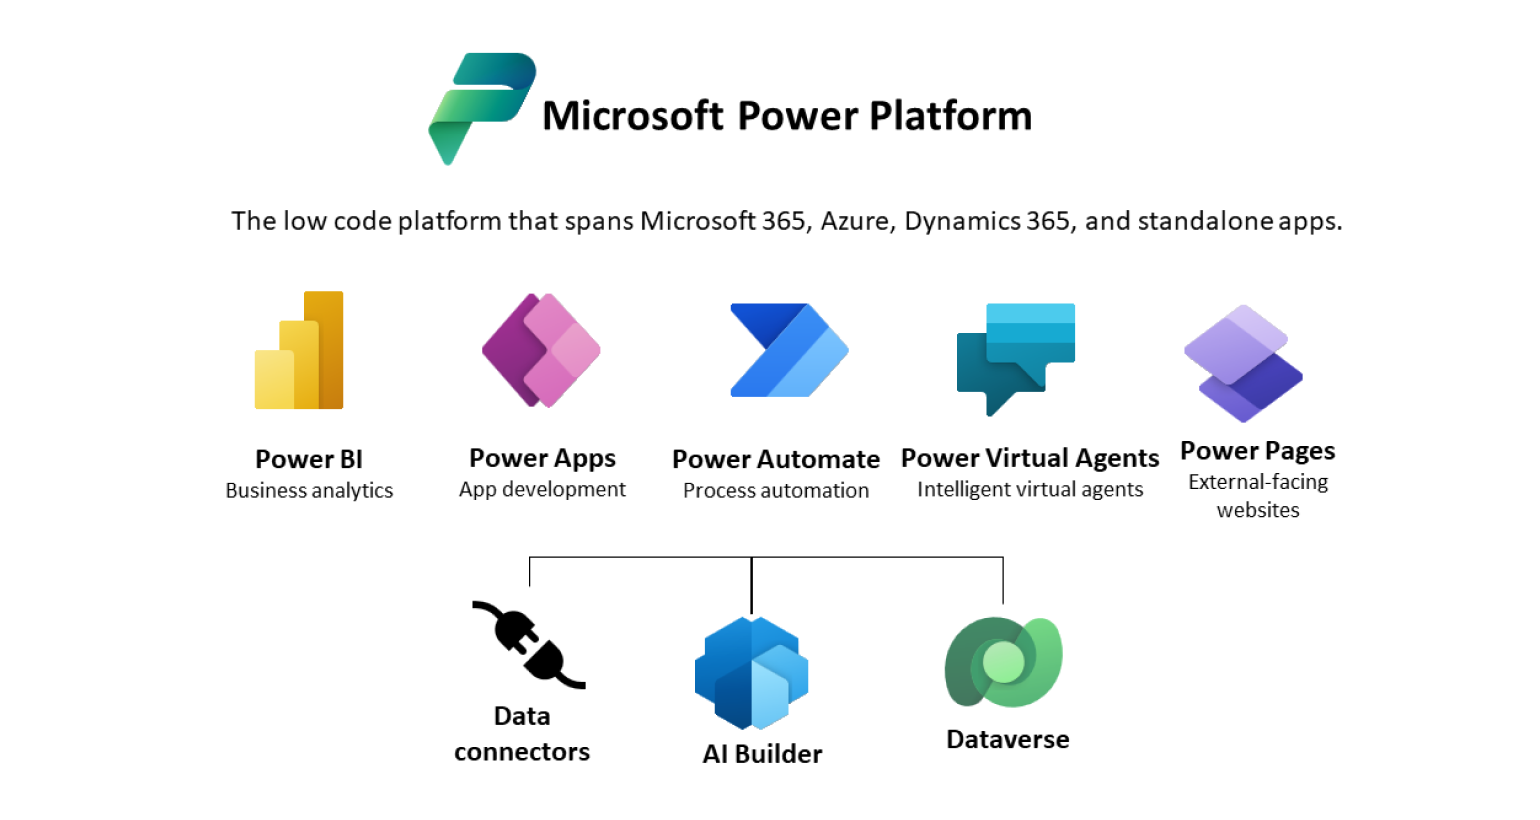
- Power BI – This is a reporting tool that can be used both as an application on a computer and online. Power BI supports data integration from various sources, such as Excel, SQL databases, or direct connections to other databases. It also allows working on models created by the developer. You can confidently start using Power BI yourself, for example, by reading data from a personal Excel table. It's quite simple. See here for instructions.
- Power Apps – If there is a need to enter data, then Power Apps offers a simple and quickly created solution. With it, you can develop web applications that are directly connected to the data warehouse, allowing users to enter and manage data operationally.
- Power Automate – An online tool for automated data processes.
- Power Virtual Agents – Chatbots created to simplify communication and automatic response generation in MS Teams.
- Power Pages – A tool for creating web interfaces, which allows the creation of web pages to display Power BI reports and provide interactive data analysis tools.
In Summary
Data analytics plays an important role in making business decisions. Effective BI solutions and their development are based on clear standards and best practices, using appropriate reporting and analysis tools.
We hope you found useful information in our article that will help you better navigate the complex world of data analytics and successfully apply it to achieve your organization's goals.


