

How do usability statistics supplement usability testing?
User experience can be improved by using various data that can be gathered via different research methods. The different types of data can also be combined with each other and thus used to supplement each other as well.
In this article, we will take a closer look at two types of data: usage statistics (quantitative data) and usability testing (qualitative data). We will also briefly introduce the tools for gathering this data.

Table 1: A comparison of the usage statistics and usability testing methods. Source: Lou Rosenfeld – Beyond User Research + the author’s modifications
Great examples of quantitative data are population censuses and the data that Statistics Estonia gathers in general, which can be found on their website (http://www.stat.ee/en). In the field of UX, we also use various methods to gather quantitative data.
For example, Google Analytics provides with data such as how many people are using an app on their smartphone, how many customers out of everyone who clicked on an ad actually purchase something (the so-called conversion rate), how long users stay on the website or a specific subpage etc.
Speciality survey software (SurveyMonkey, Typeform) can be used to easily create mobile-friendly surveys that are convenient and simple to fill out. Hotjar and CrazyEgg can be used to create heatmaps, which give a visual overview of where users click the most, how far down they scroll on a page and how they move the mouse around. This data can be gathered separately for desktops, tablets and smartphones.
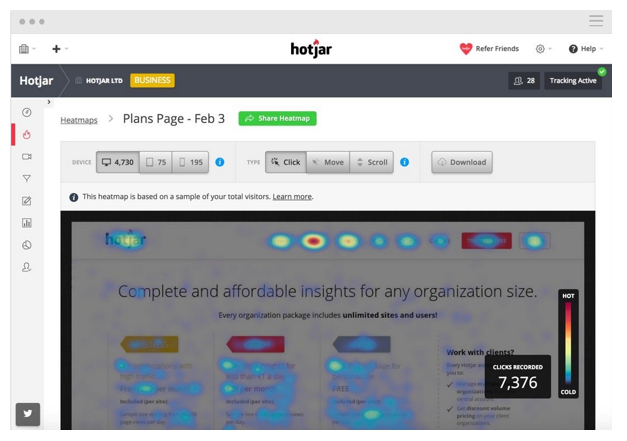
Figure 1: An example of a quantitative method – Hotjar’s heatmap, which shows the intensity of user clicks on a website (source: www.hotjar.com)
Some of the most used qualitative research methods in the field of UX are open interviews, user tests, observations, personas, card sorting and many others. If quantitative methods mainly employ data that already exists, then in the case of qualitative methods, the data is created by the researcher by employing the appropriate method.
Of course, a proper qualitative approach requires the researcher to first do some very thorough and well thought through preliminary work and analyses. For example, the preparations for user testing usually take a lot more time than actually conducting the tests.
Preparing for interviews may take a few days to ensure that their scope throughout the project is correct, which is necessary since a badly structured interview will not provide the researcher with the information they need.
Above all, these types of research methods are used to get answers to questions about user habits, to understand how these habits have formed and how the user got to them. For example, we can direct the user to perform the activities we consider important during website usability tests by giving them specific tasks.
This will allow us to observe how they solve the tasks and to find out how they reach their solution to it.
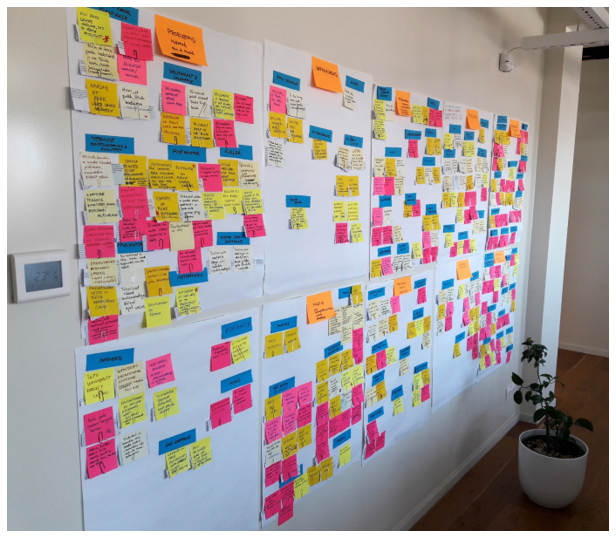
Figure 2: An example of a qualitative method: card sorting used to create personas at Trinidad Wiseman
To get as comprehensive an overview as possible of users and their behaviour and experiences, we must combine both research methods. By using only one of the two approaches, we will not be able to get a full overview of everything and/or we can never be completely sure of the knowledge we do have.
It is very easy to come to the wrong conclusions for ourselves or our clients if we are missing important bits of information or need to make too many interpretations based on the little amount of information we have.
For example, if you only employ qualitative methods, there is a risk of the researcher having too much of an impact on the results and even more, the results are completely dependent on the researcher’s competence.
But if you only use quantitative data, then you run the risk of coming to dangerous conclusions based on a statistical trend, because we do not actually know the reasons behind those numbers. This may cause us to make vague assumptions about them which are definitely not suitable grounds for making business decisions.
Here are a few examples of how usage statistics can supplement usability testing and how you could combine them.
1. Usage statistics > usability testing
If we employ software that analyses web usage (e.g. Google Analytics) and can get data about how much users are clicking or not clicking on certain content, then we can use that information as great input when creating usability testing tasks.
As a result of the synergy between the two methods, we can gather more precise data about possible usability issues on the website or in the app.
2. Usability testing > usage statistics
If we see certain trends arise during usability testing, such as the user not scrolling down to the important content on a page, then we can check the general usage statistics to confirm or disprove this trend. From there, we could see that only 25% of the users scroll down to the desired content or that only 9% of the users open that content.
As a result, we are able to come to more definite conclusions about what needs to be changed, such as moving that content higher up on the page or making scrolling on the page more attractive.
3. Usability testing + usage statistics
By using web surveys (e.g. Typeform), we can gather useful information for both the quantitative and qualitative parts. By leaving some of the questions open for freeform answers and some closed, we can get both types of input for usability testing – closed questions help us identify emerging patterns and to answer the questions of “how much” and “who”, while open questions help us answer the question of “why”.
When putting together recruitment surveys, a smart UX designer will also account for the benefits that the project and the client can gain from this. For example, the information gathered could be used as input for new activities or methods afterwards, such as (group) interviews, user tests, workshops etc.
4. Longitude research via usability testing and usage statistics
Probably the most important and most useful way of coming to any conclusions for the client is to be able to show them the processes or trends on their website or in their app. Longitude research compares two (or more) different time periods. The start and end of these time periods could be a specific event or a seasonal cycle.
The event could be a period when the website’s usability was improved, the implementation of a new design or the enhancement of a function (e.g. the search field). By using the same testing tasks for usability testing for both periods, we can very specifically compare the usability between two different environments and also compare the results to the general usage statistics.
At Trinidad Wiseman, we use both quantitative and qualitative data and research methods to get a better, more enriched overview of what is happening on the client’s website or in their app and how it is being used.
As a result, we get a very adequate understanding of the current user experience, which we can then use to improve the user experience in an efficient manner that creates results.


